Poisson Confidence Interval
Menu location: Analysis_Parametric_Poisson Confidence Interval.
This function enables you to construct a confidence interval from a sample of observations drawn at random from a Poisson distribution.
Note that the Analysis_Distributions_Poisson menu item also provides Poisson confidence intervals for single counts. The function described in this section provides Poisson confidence intervals for series of counts.
The Poisson mean is estimated here as the arithmetic mean of the sample and the confidence interval is estimated using the relationship between the chi-square and Poisson distributions (Stuart and Ord, 1994; Johnson and Kotz, 1969):
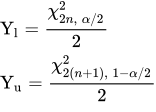
- where χ2α,ν is the chi-square deviate with lower tail area α on ν degrees of freedom and n is the total count (the sum of the observations); Yl and Yu are the confidence limits for the total count, and the limits for the Poisson mean are Yl/N and Yu/N where N is the sample size (the sample mean is the point estimate).
Example
Test workbook (Parametric worksheet: Reception).
Consider the following numbers from a hypothetical time and motion study in a hospital outpatients department. The numbers represent the number of patients arriving at the reception desk at five minute intervals during the mid-afternoon:
2, 1, 1, 0, 2, 1, 0, 2, 3, 1, 0, 1, 2, 2, 1, 0, 0, 1, 1, 2, 2, 1, 1
In order to analyse these data in StatsDirect you should enter them into a workbook and then select Poisson Confidence Interval from the Parametric section of the Analysis menu. You are asked for a confidence level; the report gives the two sided interval and the one sided limits at that level.
For this example:
Poisson confidence interval
Sample name: Reception
Size = 23
Mean = 1.173913
Exact two sided 95% CI = 0.773616 to 1.707982
Exact one sided 95% confidence limits: lower 0.828613, upper 1.618877
The interval is exact: its limits are the means with which a total count as large as the one observed or larger, and as small or smaller, has half of what the confidence level leaves. The two one sided limits are given together. With 95% confidence the mean is above 0.828613, and with 95% confidence it is below 1.618877; the two are the ends of the two sided 90% interval.

 R code
This R code reproduces the example above. It needs no packages and was checked with R 4.6.1. Paste it into R, or save it as a script and run it.
# Poisson confidence interval: the StatsDirect help example (patients arriving at
# a reception desk in 23 five minute intervals) in R
counts <- c(2, 1, 1, 0, 2, 1, 0, 2, 3, 1, 0, 1, 2, 2, 1, 0, 0, 1, 1, 2, 2, 1, 1)
n <- length(counts)

# R's standard function takes the total count as one Poisson observation over a
# time base of n intervals, so its event rate is the mean count per interval and
# its confidence interval, from the chi-square distribution, has the limits
# StatsDirect reports.
r <- poisson.test(sum(counts), n)
print(r)

# The report's lines, to 6 decimal places
six <- function(x) formatC(x, digits = 6, format = "f", drop0trailing = TRUE)
cat("Size =", n, "  Mean =", six(mean(counts)), "\n")
cat("Exact two sided 95% CI =", six(r$conf.int[1]), "to", six(r$conf.int[2]), "\n")
# StatsDirect also gives the one sided 95% lower and upper limits, which are the
# ends of a two sided 90% interval
ci <- poisson.test(sum(counts), n, conf.level = 0.9)$conf.int
cat("Exact one sided 95% confidence limits: lower ", six(ci[1]), ", upper ", six(ci[2]),
    "\n", sep = "")